Subway ridership in 2025 grew by almost 93 million riders over 2024 to a total of nearly 1.3 billion, largely driven by the implementation of Congestion Pricing on January 5, 2025. The year-over-year increase was particularly significant, with the 7.7% growth more than double the 3.7% of 2024, bucking a post-pandemic slowdown in ridership growth but still remaining under the system’s capacity. Subway ridership plummeted following the COVID pandemic, and 2025 marks a year of major progress for a return to pre-pandemic ridership.
Observing and documenting where, when, and how ridership patterns changed throughout the subway system as a result of congestion pricing presents an opportunity to identify where demand could warrant increased service and investment. In this report, we analyze ridership changes at subway stations across the city between 2024 and 2025 at various times of day and into the Congestion Relief Zone (CRZ).
Above all else, the below analysis shows that the worst-case scenario that anti-Congestion Pricing fearmongers purported is objectively false: considerably more riders are traveling using the subway than before Congestion Pricing began, and people are indeed still traveling to and from Manhattan’s Congestion Relief Zone.
Key Findings
- Between 2024 and 2025, total systemwide ridership grew from 1.21 to nearly 1.3 billion riders – a 7.7% increase
- Weekend ridership grew at larger rates than the overall citywide average: Total weekend ridership grew by 9.4% – a total increase of 21,880,420 riders
- 39 stations saw full-year ridership grow more than 20%
- Times Square-42nd St saw the largest overall increase in rides between 2024 and 2025 with 2,564,747 new riders, a 5.6% increase
- The Bedford Avenue L station had the largest overall increase in rides on weekends in 2025 with 555,760 new riders, a 23.7% increase
- Only 38 stations saw ridership decreases in 2025, including 12 stations that had significant service impacts due to the reconstruction of the Hammels Wye on the Rockway Peninsula
- To the CRZ:
- AM peak subway trips to the CRZ grew by a daily average of 40,589, or 7%
- Weekend trips to the CRZ grew by a daily average of 60,035, or 7.5%
- Total rides to the CRZ grew by an estimated 20,182,143, or 7.1%
- 95 out of 424 stations saw more than 20% growth in ridership to the CRZ on weekends vs just 31 stations during AM-Peak.
- 100 stations saw 20% or higher ridership on weekends in 2025 than 2024
- System-wide ridership growth slightly outpaced ridership growth to the CRZ, indicating a higher share of riders going to non-CRZ stations: 7% AM-peak and 7.5% weekend growth to CRZ, vs. 7.7% all year and 9.4% weekend growth system wide.
Recommendations
- Invest in increased weekend subway service where needed
- Continue and expand Governor Hochul’s investment in the MTA’s operating funding
- Supplement demand for weekend service by increasing service on parallel bus routes, speeding up shuttle buses, and ensure all shuttle buses for planned service outages are trackable on the MTA app and other trip planning apps
- Continue targeted subway service increases during weekdays based on ridership growth
- Follow the scheduled increase in Congestion Pricing rates as required by the Re-evaluation and VPPP agreement
- Expand fare discounts and transfer options between the subway, bus, and commuter rail
- Increase bus service and speeds around the five boroughs
Analysis

Trips originating outside Manhattan increased the most between 2024 and 2025; the Bronx had the largest ridership gains, followed by Brooklyn. Manhattan saw the smallest increase in ridership, just below the overall citywide average.
To put these numbers in historical context, the 1.299 billion rides in 2025 was roughly the same as 1999’s ridership, and 76.5% of 2019’s 1.698 billion rides. Following two years of significantly depressed ridership in 2020 and 2021, ridership grew by 33% in 2022 and 15.6% in 2023 before declining to only 3.7% growth in 2024.Ridership recovery on the weekends post-pandemic has continued to outpace weekday ridership.

Figure 1: Total Change in Subway Ridership between 2024 and 2025 by Station
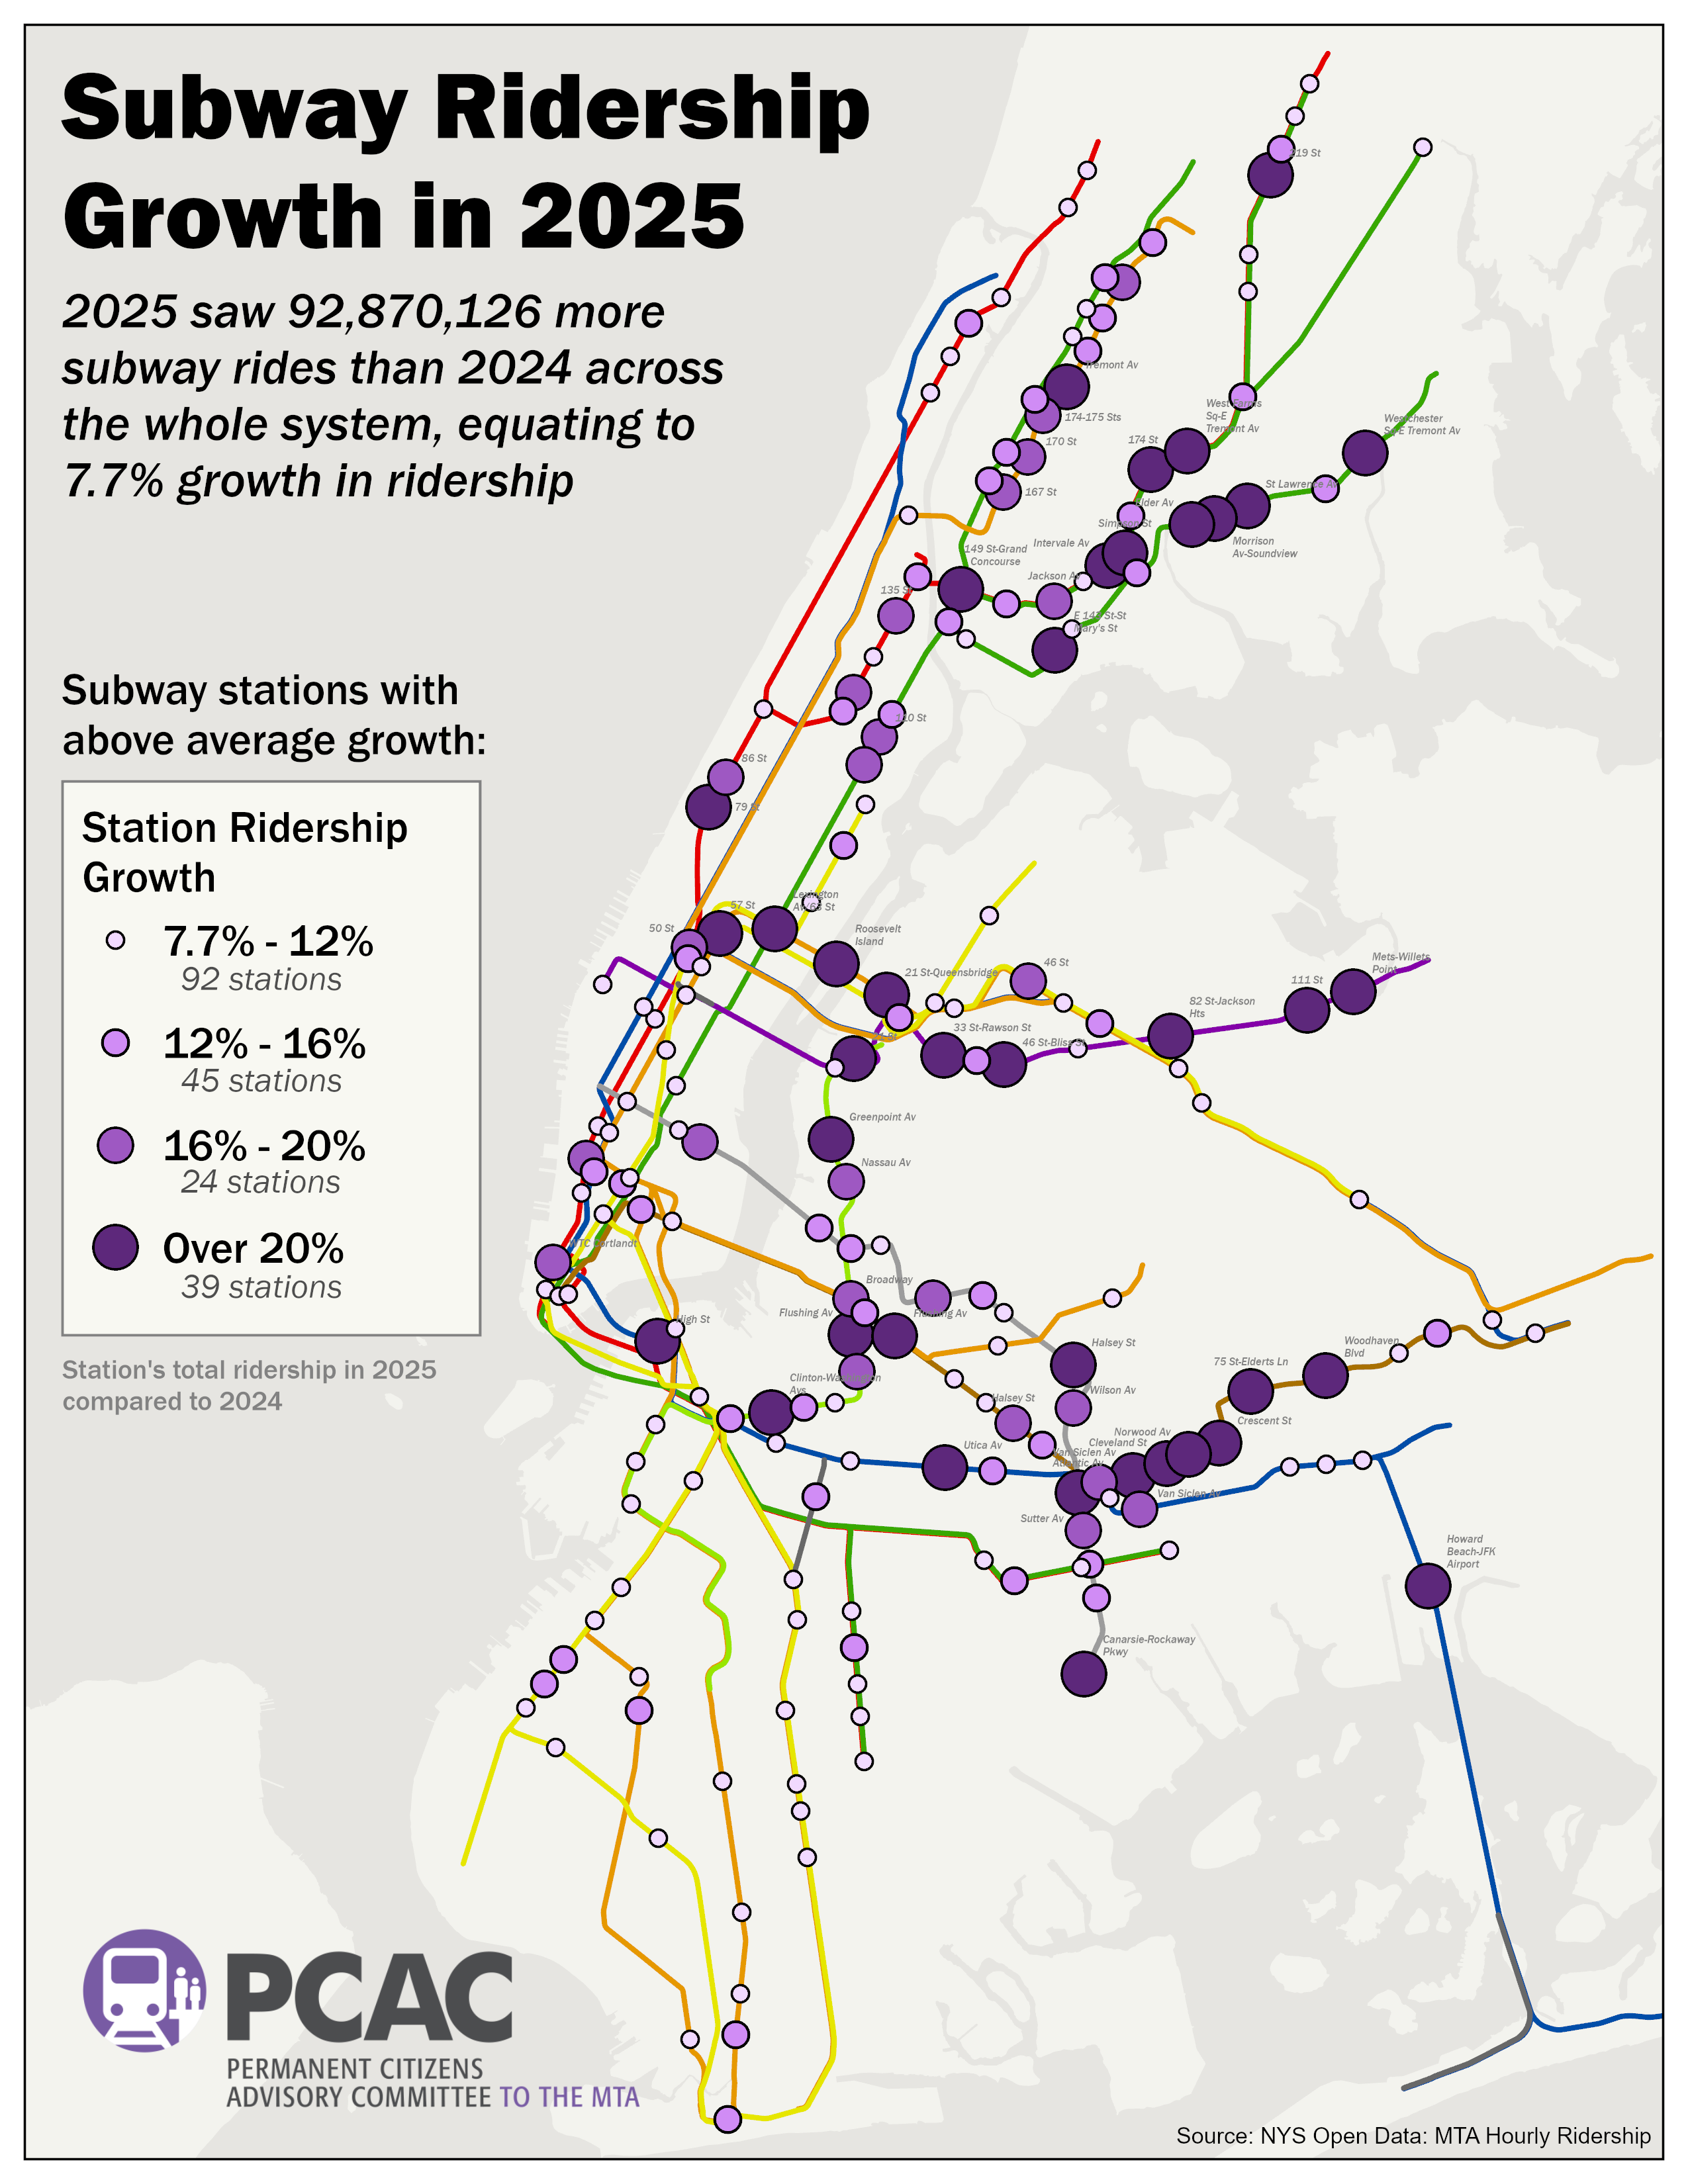
Subway ridership grew substantially around the system in 2025, with a 7.7% increase overall. Subway stations with an above average growth in ridership are indicated in purple in Figure 1, above. Stations in the South and East Bronx, East New York, Cypress Hills, Williamsburg, and Western Queens saw some of the largest ridership gains. The Canarsie-Rockaway Parkway L train stop saw the largest overall ridership increase by raw volume, with 2025 ridership over three times its 2024 ridership, and was the only non-Congestion Relief Zone station in the top eight by volume.
Figure 2: Change in Weekend Subway Ridership between 2024 and 2025 by Station
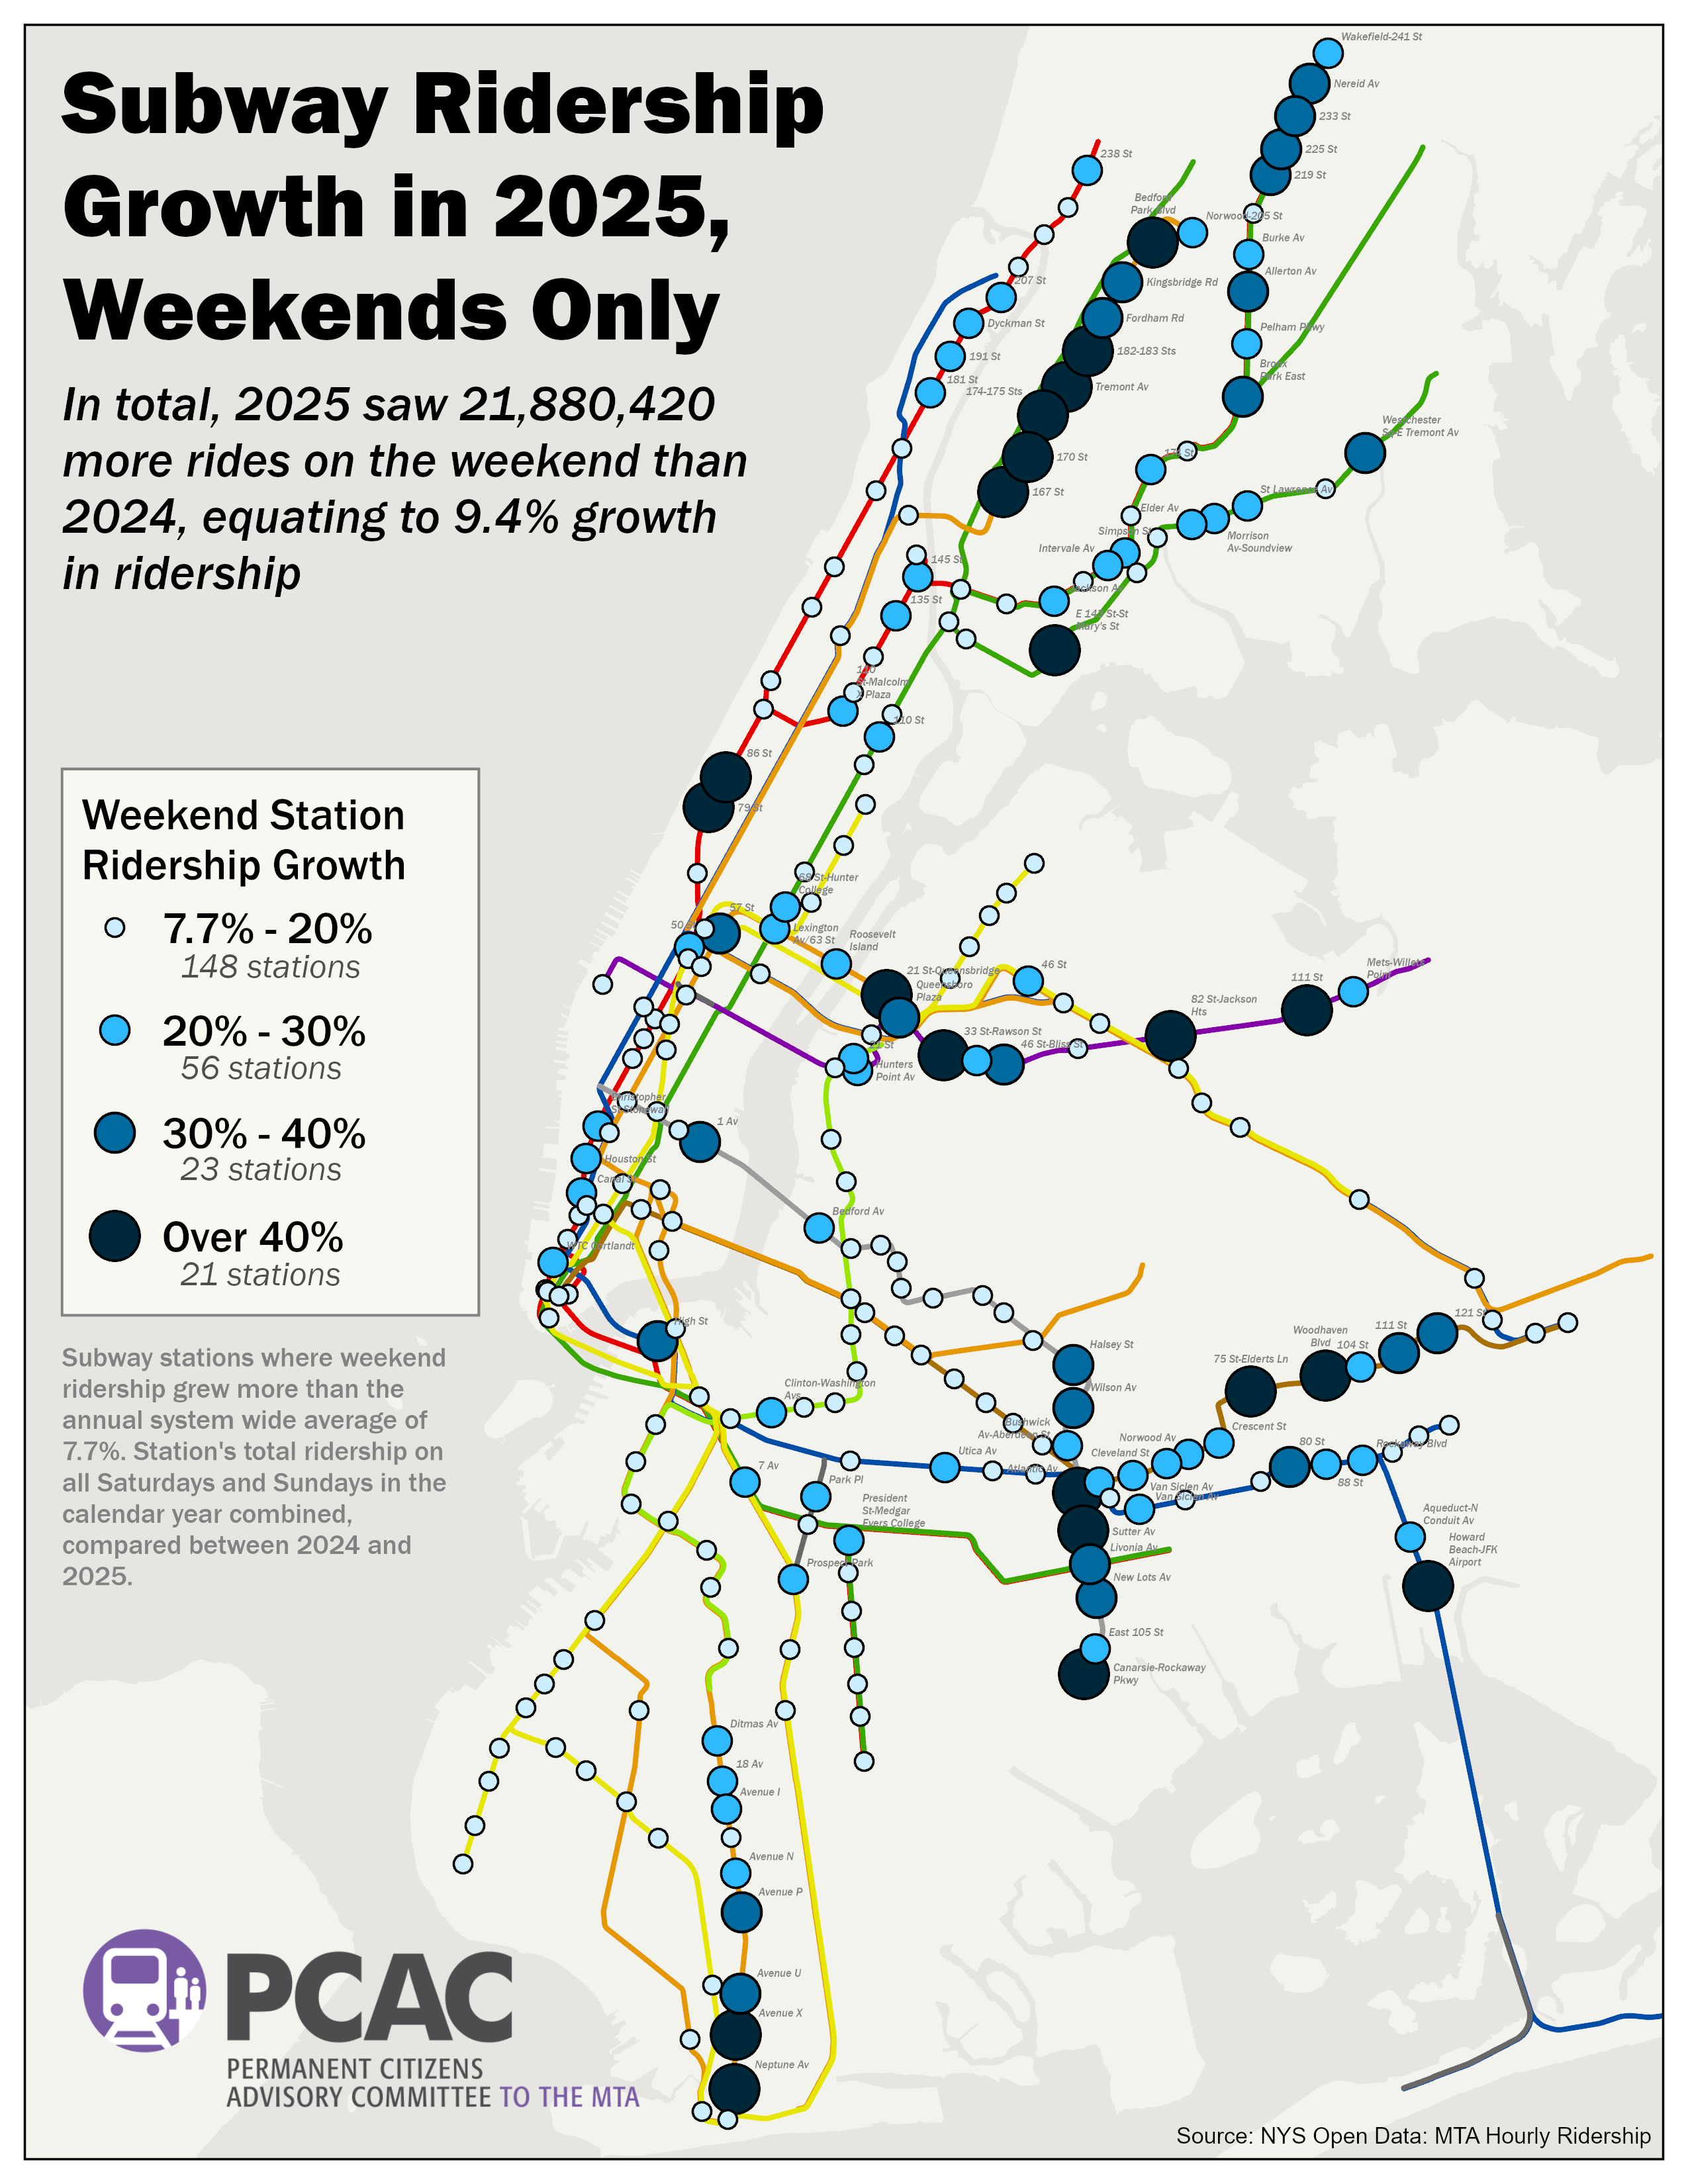
Across the city, weekend ridership boomed between 2024 and 2025. Ridership on weekends grew 9.4% over this period, outpacing the average of 7.7% across all time periods, indicating that weekends and discretionary trips in Brooklyn, Queens, and the Bronx are largely driving overall ridership increases. The Bedford Ave L train station saw the largest raw number of new trips in 2025 compared to 2024, outpacing even tourist hubs like Times Square — Bedford Ave saw 555,760 more weekend rides than in 2024, followed by Times Square with 550,287. While many stations in the Congestion Relief Zone saw large numbers of new riders between 2024 and 2025, stations outside of Manhattan saw the largest percentage change in weekend trips during this period.
Figure 3: Change in AM Peak Subway Trips into the Congestion Relief Zone between 2024 and 2025 by Station

Morning peak ridership into the Congestion Relief Zone increased 7.1% overall. This is on pace with but slightly below the overall yearly ridership growth of 7.7%, indicating that rush hour trips did not account for the majority of ridership growth. This could be attributed to the fact that the majority of workers in the Congestion Relief Zone were already commuting using transit before Congestion Pricing went into effect, and continued to do so afterwards. The stations that saw the largest percentage change increase of trips into the Zone during the morning rush are concentrated in neighborhoods including East New York and the East Bronx, along with stations directly outside of Manhattan in neighborhoods like Long Island City, Brooklyn Heights, and Downtown Brooklyn. While the data is not conclusive enough to confirm, this could indicate that some commuters who may have driven into the Congestion Relief Zone in the past have opted to drive or walk to stations directly outside the zone, than take the subway.
Figure 4: Change in Weekend Subway Trips into the Congestion Relief Zone between 2024 and 2025 by Station
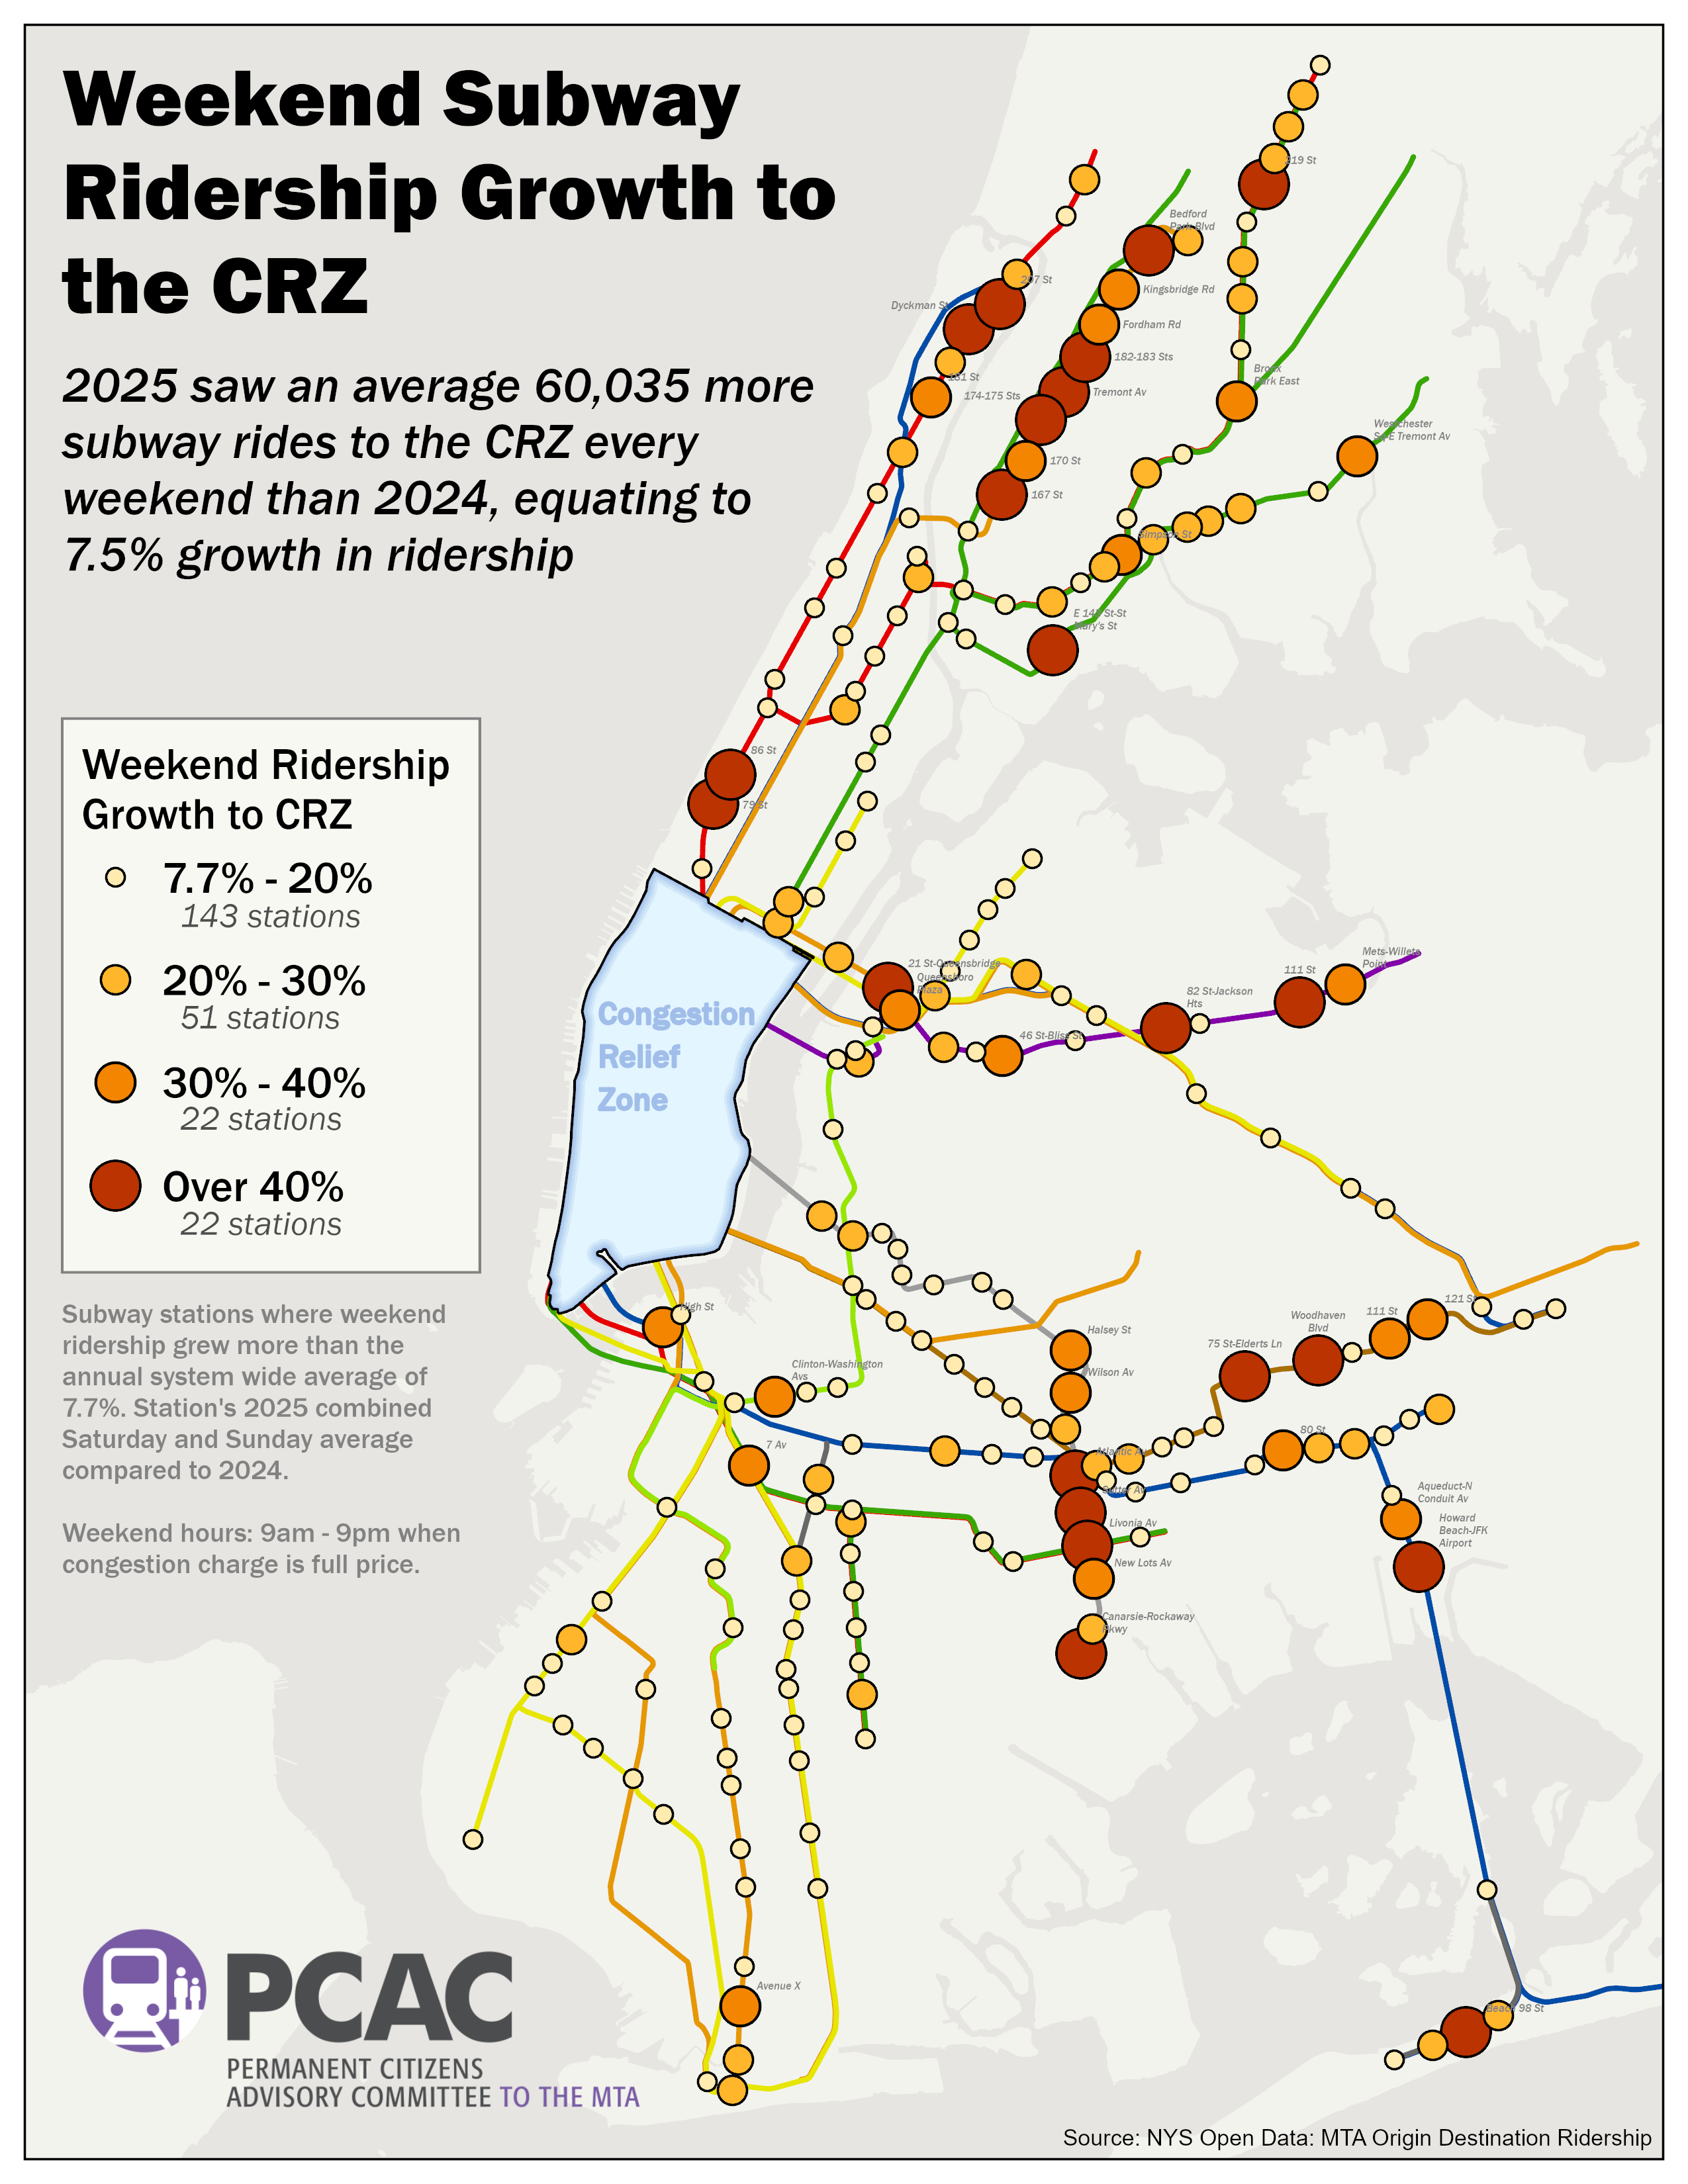
Weekend ridership into the Congestion Relief Zone increased 7.5% overall, just slightly below the overall citywide average of 7.7%. While trips into the Zone have increased definitively between 2024 and 2025, both during the morning peak and the weekends, discretionary travel around the five boroughs has driven ridership gains the most (Figure 2). Bedford Ave on the L train saw the largest ridership growth by volume on weekends into the Congestion Relief Zone, indicating that this station may be experiencing a boom in tourism in addition to housing growth. The stations with the largest percent change increases in weekend ridership to the Congestion Relief Zone are concentrated along the L line in Brooklyn, the B and D trains in the Bronx, and scattered throughout the boroughs; it’s important to note that some of these ridership increases may be attributed to service outages in 2024.
Recommendations
Invest in increased weekend subway service where needed
Weekend ridership has steadily increased both post-COVID and post-Congestion Pricing, outpacing weekday growth. Capacity remains in some parts of the system, yet subway service remains less frequent on than on weekdays, missing opportunities to support rider demand. Subway improvement projects and General Outages (GOs) are necessary on weekends and late nights, which complicates providing increased service where needed, but service could be increased on lines and weekends when these outages are not scheduled.
Continue and expand Governor Hochul’s investment in the MTA’s operating funding
Governor Hochul and the state legislature have steadfastly committed to funding the MTA’s operating budget. As the need for increased service rises, so will the need for additional investment in the MTA’s operations.
Supplement demand for weekend service by increasing service on parallel bus routes, speeding up shuttle buses, and ensure all shuttle buses for planned service outages are trackable on the MTA app and other trip planning apps
Shuttle buses are currently used to fill in gaps when subway outages occur during General Outages (GOs), most commonly during weekends and late nights. But when riders are planning their trips, these shuttle buses are often not trackable on the MTA’s app or other trip planning apps and websites, making it difficult to determine the best route and time journeys. All shuttle buses supplementing subway service should be trackable on the MTA and other trip planning apps.
Continue targeted subway service increases during weekdays based on ridership growth
In 2025, the MTA announced and implemented service improvements on the L train during rush hours based on demand and crowding at hub stations. This was a great example of using data to target specific service improvements and find creative ways—such as turning around trains earlier in their runs to add additional capacity during peak hours—to work with current rolling stock and workforce while improving service.
Follow the scheduled increase in Congestion Pricing rates as required by the Re-evaluation and VPPP agreement
Congestion Pricing is working. While ridership is going up citywide, it’s clear that Congestion Pricing is leading to better air quality, transit improvements, faster traffic speeds, and safer streets. Riders are traveling into and around the Congestion Relief Zone at higher rates than before. To continue to see benefits from this transformational program, it’s important that the scheduled rate increases proceed as initially planned.
Expand fare discounts and transfer options between the subway, bus, and commuter rail
Many of the stations and neighborhoods that saw the largest ridership gains are also served by the LIRR and Metro-North, including in the Bronx, East New York, and Eastern Queens. Offering joint tickets between the Railroads and New York City Transit would help ensure that all riders can afford the fastest trip available to them.
Increase bus service and speeds around the five boroughs
Demand for transit is increasing, and as subway ridership continues to bounce back, it’s also important to improve bus service so that riders have ample options for traveling around the five boroughs. PCAC’s BRT for the Boroughs report lays out recommendations for speeding up buses and implementing true Bus Rapid Transit in New York City.
Additional Considerations
This report aims to identify high-level trends in ridership and hypothesizes about why these trends have occurred. It’s important to note that many factors contribute to ridership changes, including but not limited to: policies like congestion pricing; changes in fare enforcement; new housing growth; service outages and planned work; and major events. The findings and analysis of this report open additional questions about factors that drive ridership growth at the station and line-level, and can lead to future research projects.
Methodology
Two datasets were used to create this report, the MTA’s hourly subway ridership dataset (Beginning 2025 and 2020 – 2024) and the MTA’s origin destination dataset (Beginning 2025 and 2024).
MTA’s hourly subway ridership data counts the number of swipes and taps into each station complex (stations that are connected where you can walk between platforms without leaving the system) every 15 minutes for the entire year. This data was aggregated and summarized to give the total amounts of station rides per station for each calendar year, or filtered based on day of week to result in total weekend ridership. This data does not count unpaid rides, but does count every form of paid ride, including MetroCard swipes, ONMY taps, Fair Fares cards, etc.
MTA’s origin-destination ridership data records when each individual card enters the system, and assumes where the next time that same card enters the system was the destination for that first trip. Though not perfect, it is generally accepted that this is a sufficient method of recording the ridership between every pair of two stations on the system at every hour of every day of the year. This data was filtered for time of day and day of the week as well as filtered for destinations in the CRZ only, then summed and averaged to create a daily average number of rides to the CRZ from each station outside the CRZ. The time/day were 5am – 9:30am M-F for AM-peak trips, as defined by the MTA; and 9am – 9pm Saturday and Sunday combined for weekend trips. This means that trips for the AM-peak represent an average for a single morning of ridership while the weekend to CRZ map represents average ridership across two days, Saturday and Sunday.
For both of these datasets, general outages (GOs) from station renovation or line work may have impacted the ridership growth represented in this report. GOs in 2024 would show higher growth than what would be expected, while GOs in 2025 would show lower growth than what would be expected. While not perfect, using data from across the entire year helps smooth over this “missing data” from service outages. For example, ridership growth on the G train may actually be lower than depicted. We have no way to fully and empirically account for GOs in the data, so we decided to show the data as it is without interference.
Acknowledgements
Report Author:
Benjy Ross, Intern, PCAC
Kara Gurl, Planning and Advocacy Manager, PCAC
Editors:
Brian Fritsch, Associate Director, PCAC
Lisa Daglian, Executive Director, PCAC
Special Thanks To:
Stuart Goldstein, New York City Transit Riders Council Member
Andrew Albert, Chair of the New York City Transit Riders Council and MTA Board Member